Insights
Analytics, spikes and reports
Buzz analytics, how spikes are detected, and the weekly report.
Trends
The Trends page shows mention volume, sentiment and platforms over any date range. Every chart is built from stored mentions, so you can open any point to see the posts behind it. Periods that weren't fully monitored are labelled. Times are shown in your own time zone.
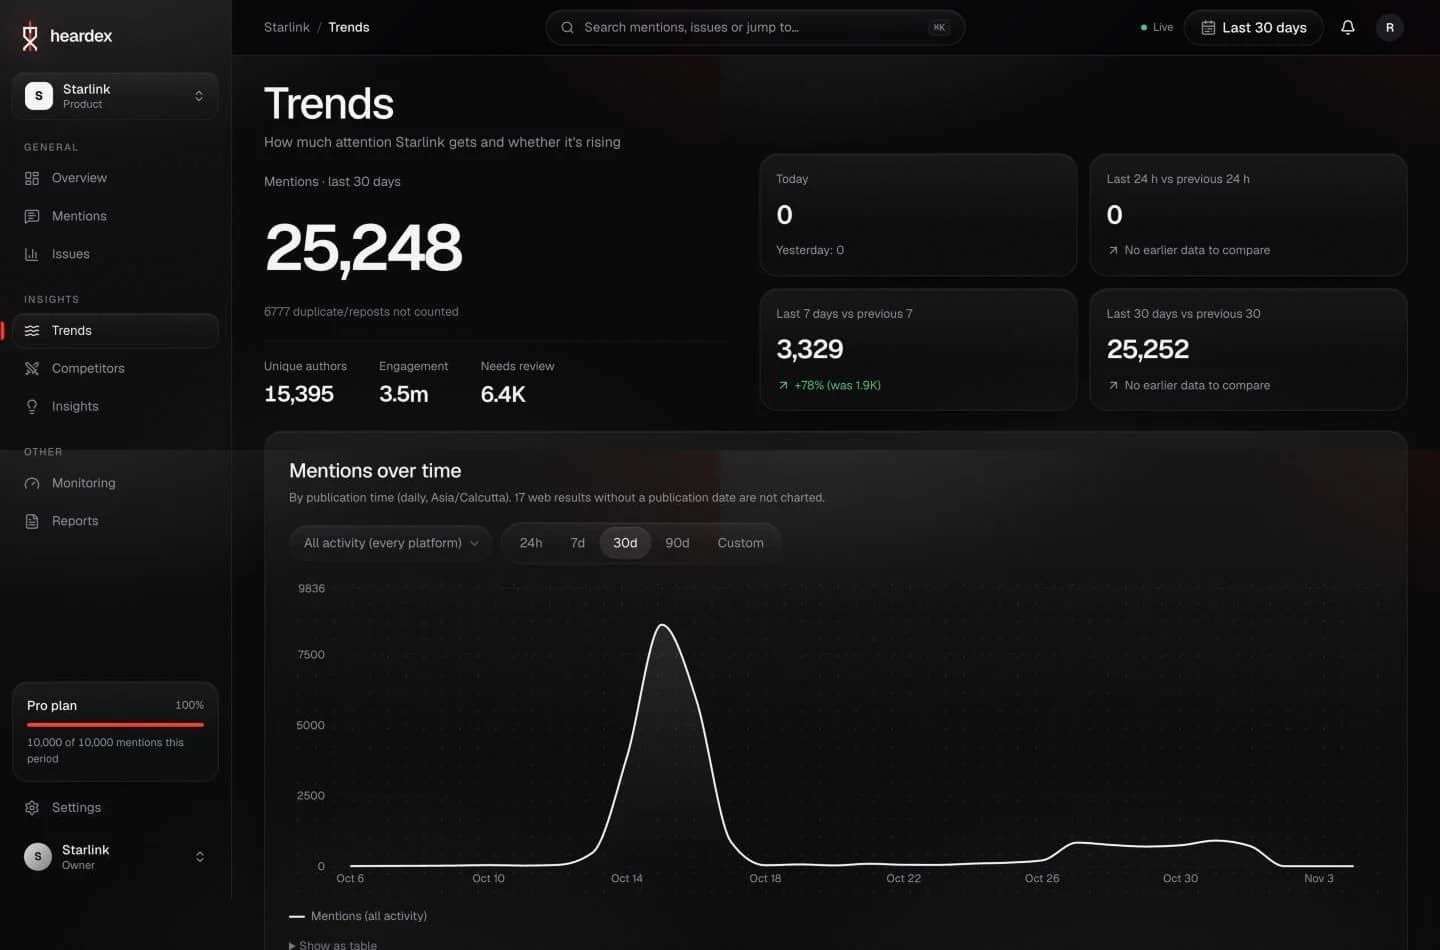
5 steps · playing
- The period's mentions. Duplicates and reposts not counted, with unique authors and engagement.
- Compared with before. Today, the last 24 hours, 7 days and 30 days against the period before.
- Activity. All activity or one platform.
- Range. 24 hours, 7, 30 or 90 days, or your own dates.
- Mentions over time. By publication day; open it as a table.
Spikes
Each day and hour is compared with its own baseline of fully monitored periods, allowing for normal weekday and time-of-day patterns. There's no fixed mention threshold: a spike is judged against your product's usual level.
- Confirmed: very unlikely to be chance, on a fully monitored period with at least 7 days (for days) or 48 hours (for hours) of baseline.
- Possible: unusual, but the period was only partly monitored or the baseline is short.
- Not enough data: less than 3 days (or 12 hours) of fully monitored baseline.
Spikes come with the platforms, keywords and posts that caused them.
Reports
- Weekly reports on Free, Starter, Pro, Scale; daily summaries on Starter, Pro, Scale.
- Every Monday a report on the week before is emailed to each member who has it on. Turn it on or off in Settings → Account.
- Reports can be printed and exported as CSV.